
Файл:QPCR results - amplification plot and melting curves.png
Размер этого предпросмотра: 339 × 600 пкс. Другое разрешение: 1014 × 1794 пкс.
Исходный файл (1014 × 1794 пкс, размер файла: 1,23 МБ, MIME-тип: image/png)
Описание
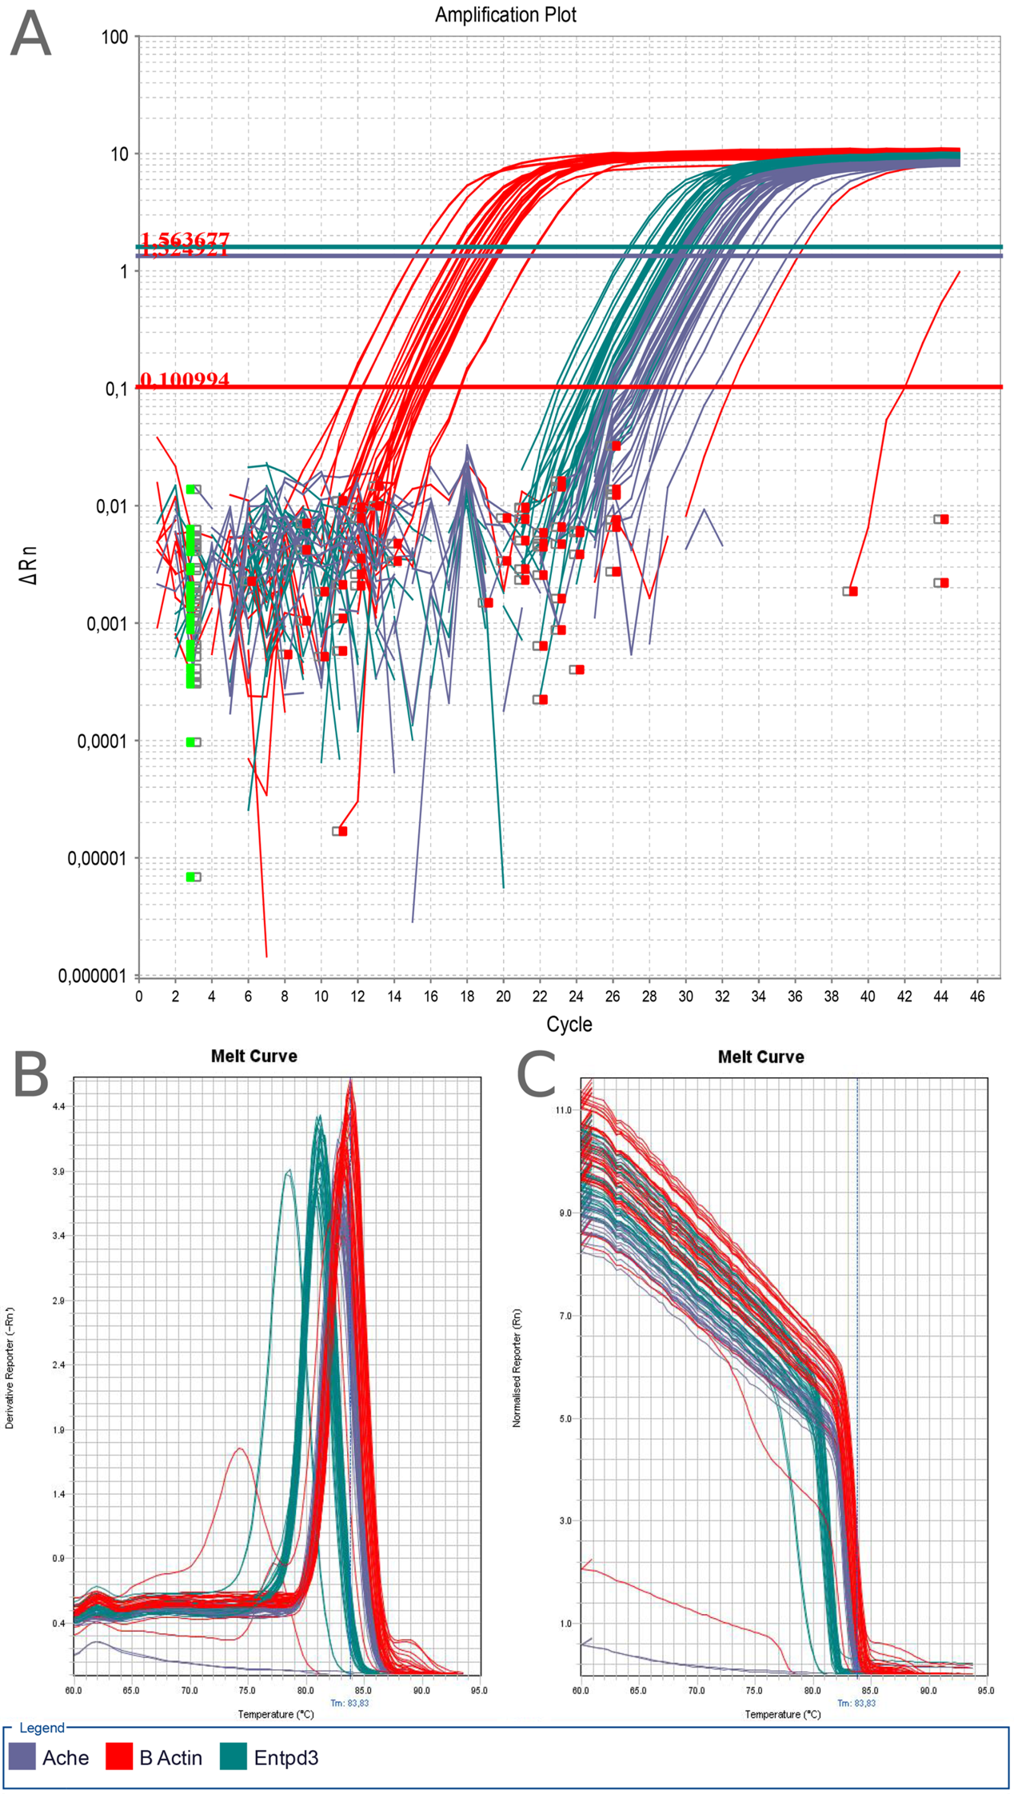
| Описание | This image is made by one of the local juries and organizers of the contest. The image is not part of the contest, and will not participate in the competition and will not be rated. But it was helluva fun to make =) and some articles really need illustrations. Image description: qPCR results with SYBR Green I fluorescent probe and using primers for Actb, Ache and Entpd3 mRNAs of Rattus norvegicus genes (all diagrams have the tree aforementioned genes differently colored). A. Amplification plot of the reaction. Each cycle (abscissa, 1-45 cycles) has an increasing amount of the product. First few cycles have not enough product to be detectable (shown as rigged lines). After threshold cycle the reaction enters logarithmic phase where the product doubles each cycle. This phase is represented by strait line. The analysis of any qPCR reaction should be done in this particular phase (tree horizontal lines on the graph are represent the sampling of results). Afterwards reaction reaches a plateau stage: no matter how many cycles pass, the mount of product doesn't increase but stays the same. At this particular graph the samples of Actb mRNA, which is a product of Actb "housekeeping" gene and is present in medium/high quantities in each tissue, reached threshold cycle earlier than Ache and Entpd3 – higher quantity of Actb is evident even without analyzing the reaction (which was done afterwards anyway ;) ) B.,C. Melting curve of the reaction shown in derivative and normalized ways (the melting curve reaction is the same, just two different ways to show it). After the qPCR reaction is completed it should be checked for specificity. For this the products are gradually heated from 60°C to 95°C (abscissa). At some temperature point each double-stranded DNA breaks down (melts) into two single strands, and the fluorescence drops down rapidly. Depending on the product size this melting point occurs at higher or lower temperatures. In this particular reaction the Entpd3 amplicons reach melting point around apx 81°C while Actb and Ache ones are a bit longer and melt at slightly higher temperatures. All three products have sizes between 133-204 bp. An ideal reaction has only one melting point for each product (three amplicons should have slightly different three melting points – depending on their size and C/G content). If any unspecific product is present (e.g. primer dimers) melting curve shows several peaks (graph B). Such samples should be omitted. |
|---|---|
| Источник | Own work |
| Время создания | 2014-09-11 |
| Автор или правообладатель | Helixitta — Лицензия: CC BY-SA 4.0 (Creative Commons Attribution-Share Alike 4.0) https://creativecommons.org/licenses/by-sa/4.0 |
| Другие версии файла | — |
Источник файла — сайт Wikimedia Commons, куда он был загружен под одной из свободных лицензий ( https://commons.wikimedia.org/wiki/File:QPCR_results_-_amplification_plot_and_melting_curves.png ). Авторов, работавших над этим файлом см. в истории файла: https://commons.wikimedia.org/w/index.php?title=File:QPCR_results_-_amplification_plot_and_melting_curves.png&action=history
В общем случае в статьях энциклопедии Руниверсалис файлы используются в соответствии со статьёй 1274 Гражданского кодекса Российской Федерации.
История файла
Нажмите на дату/время, чтобы увидеть версию файла от того времени.
| Дата/время | Миниатюра | Размеры | Участник | Примечание | |
|---|---|---|---|---|---|
| текущий | 01:26, 24 ноября 2023 | | 1014 × 1794 (1,23 МБ) | Я, робот (обсуждение | вклад) | == Описание == {{Изображение | описание = This image is made by one of the local juries and organizers of the contest. The image is not part of the contest, and will not participate in the competition and will not be rated. But it was helluva fun to make =) and some articles really need illustrations. <br/><b>Image description:</b> qPCR results with SYBR Green I fluorescent probe and using primers for <i>Actb</i>, <i>Ache</i> and <i>Entpd3</i> mRNAs of <i>Rattus norvegicus</i> genes (all dia... |
Вы не можете перезаписать этот файл.
Использование файла
Следующая страница использует этот файл: